Forums > News > MobyGames Stats - 2019 edition
vedder (70793) on 1/12/2020 9:40 PM · Permalink · Report
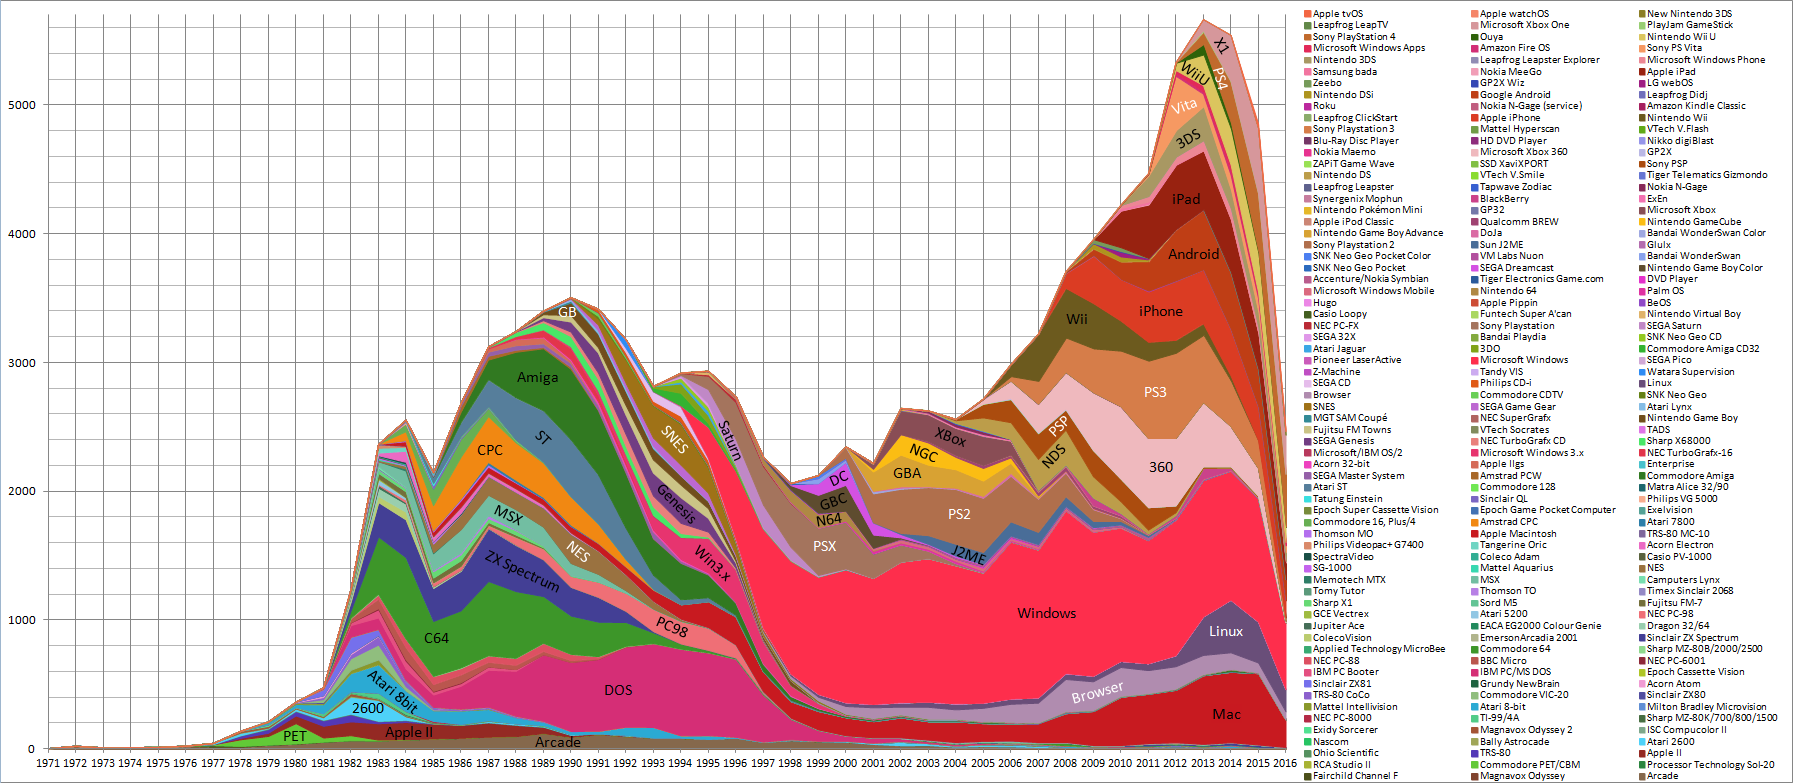
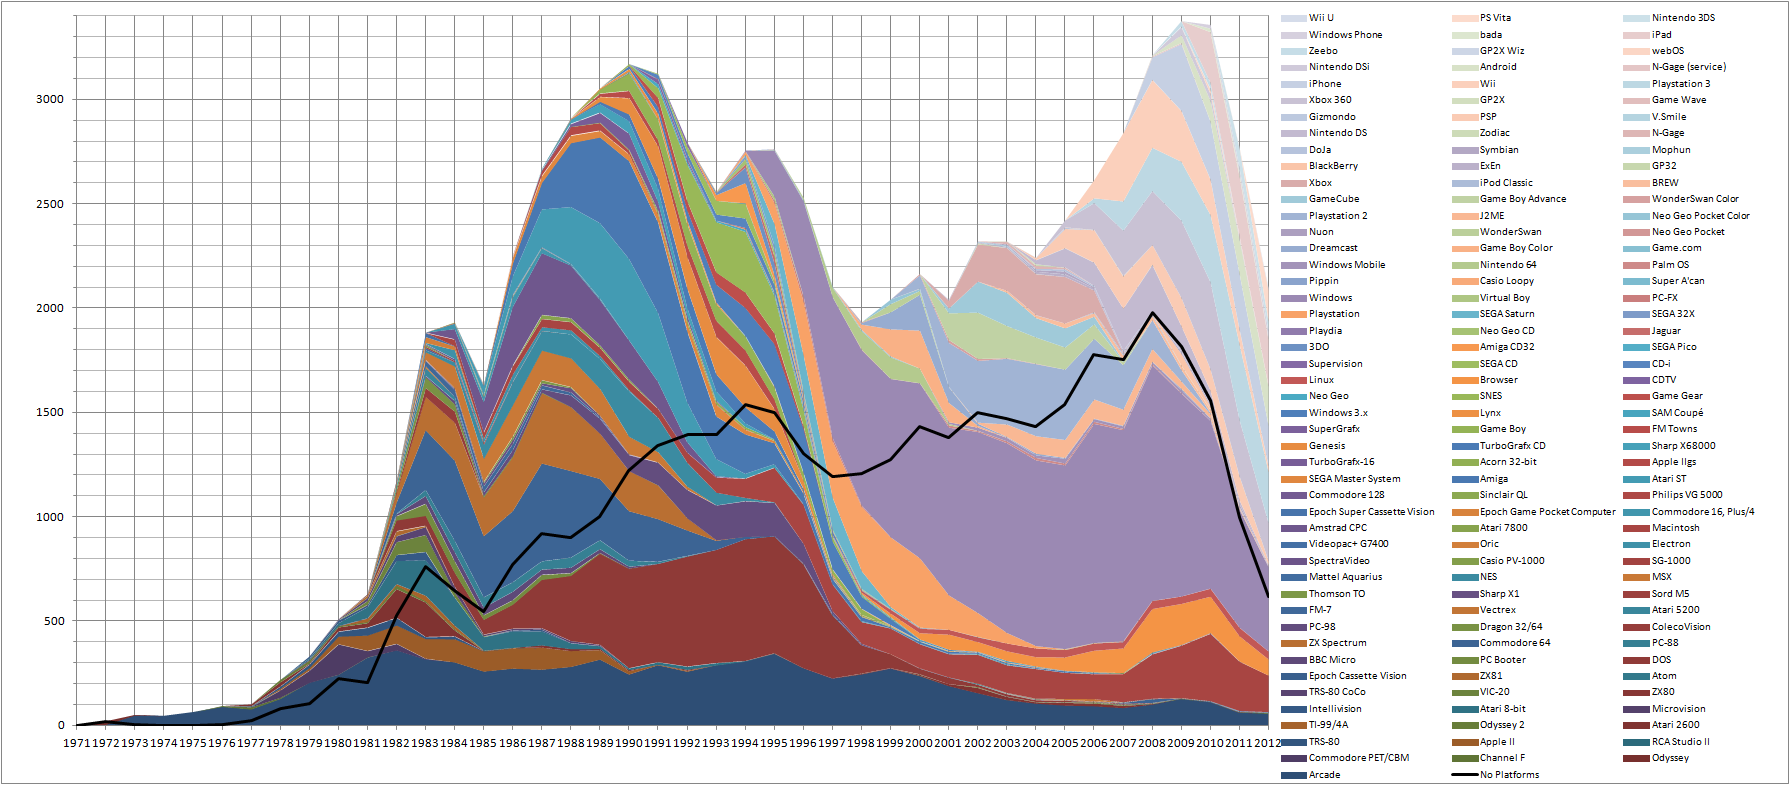
As per tradition, I present to you the database visualization! Made possible by the MobyGames API.
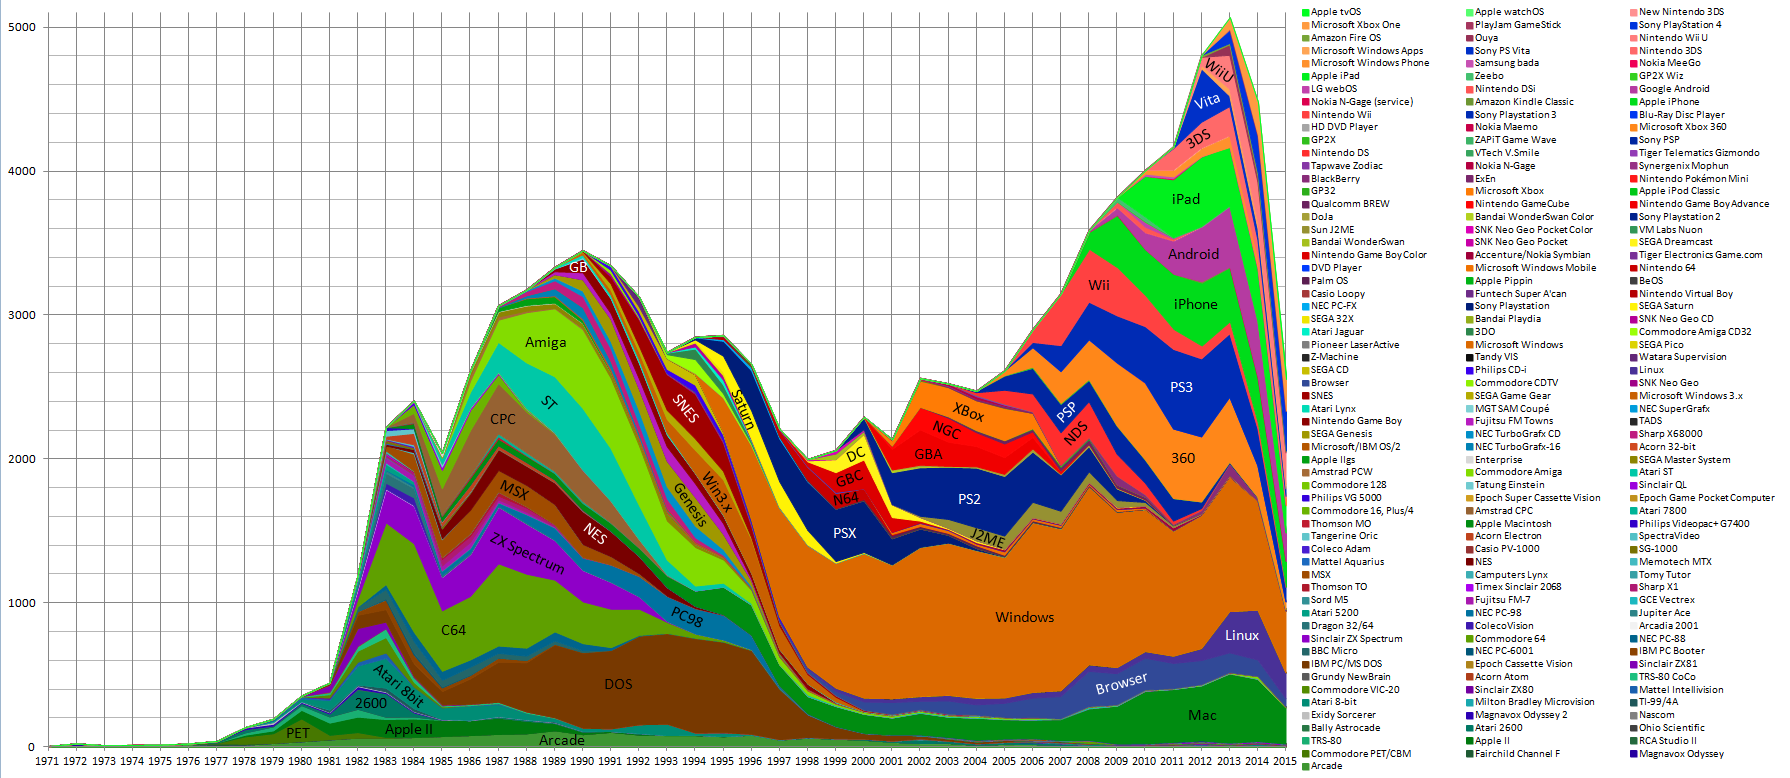
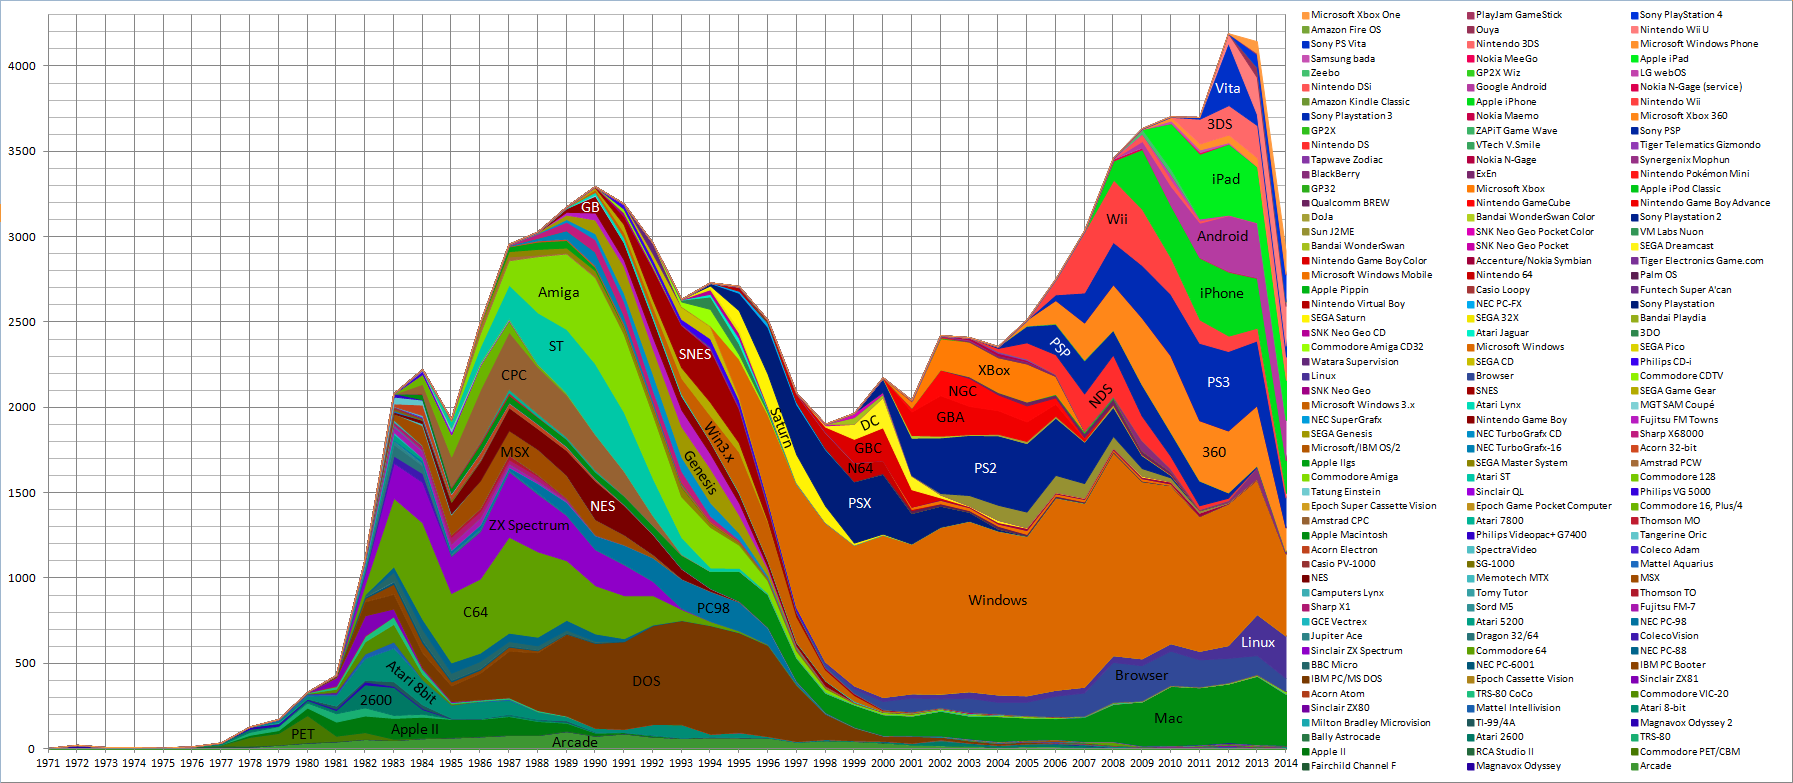
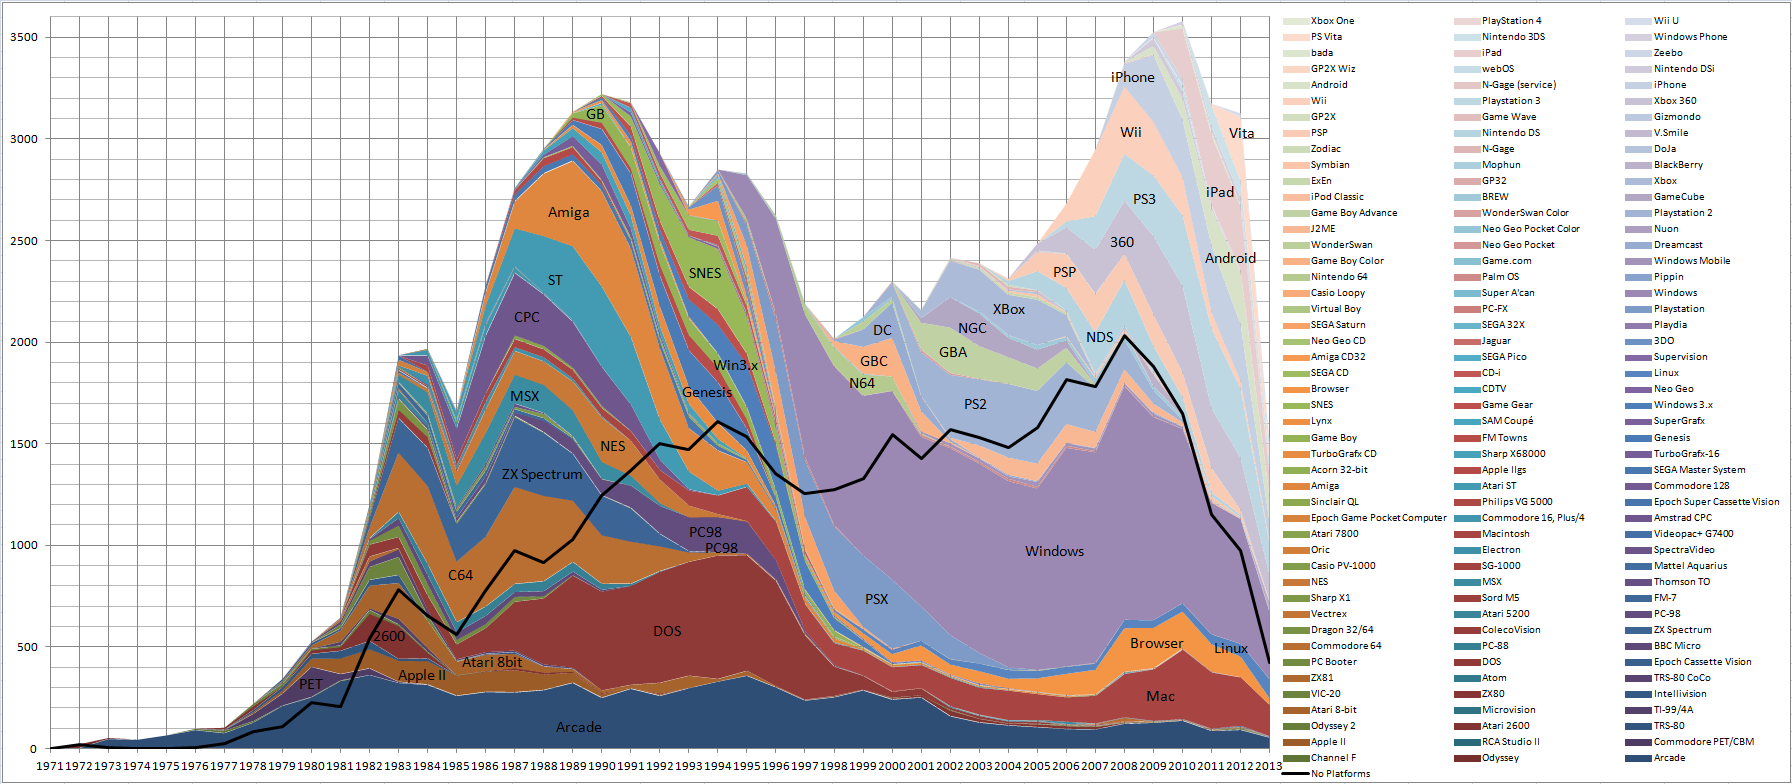
Previous editions:
January 2019 -
January 2018 -
June 2017 -
January 2017 -
January 2016 -
January 2015 -
January 2014 -
January 2013 -
January 2012 -
January 2011 -
January 2010 -
January 2009
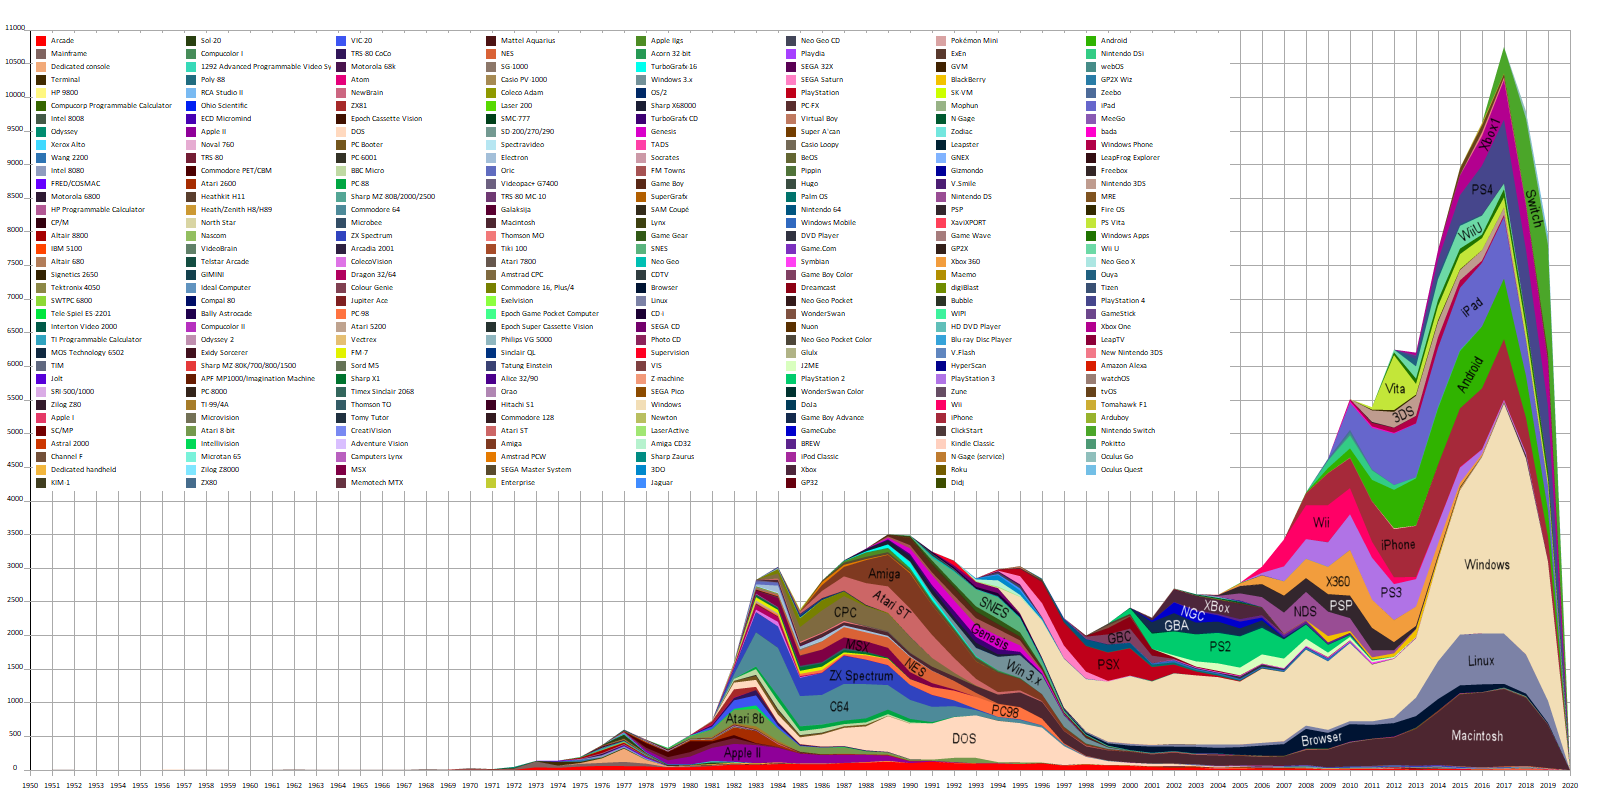
(Click to enlarge)
An explanation: each coloured shape in the graph represents a platform. The horizontal axis is time. The vertical axis represents the number of games released. So the height of a shape on a given point in time indicates the number of games released for that platform that year. The total height of the graph on a given point in time shows the total releases that year. The graph is meant to represent game releases and thus excludes DLC, Special Edition and Compilation items. It does include each game for each platform it was released on.
Notable changes since last year:
- Where last year I had to switch to LibreOffice to make the graph due to limitations in Excel, I hit some more since. I decided to write my own code to draw the graphs and nicely colour everything. Makes it look better too with some nicer anti-aliasing.
- As usual we see a drop-off at the end, simply because we haven't been able to keep up with all the new game releases.
- Feel free to point out other interesting info in the graph!
[All data taken from MobyGames. Of course, the graph is only as complete as our database is. Come help us if you can!]
MAT (240968) on 1/13/2020 12:41 AM · Permalink · Report
Great work, as always!
I wonder if it's necessary to include the current year in these graphs since the year just began and all platforms converge just back to zero (or a very small number close to zero).
Either number of games developed and released per year is really starting to grow or this is due to the scraper ;))
You know what kind of graph would be interesting to see if this isn't too much hassle? The platforms contributed over time. This shows the games as it were with their first release date per platform, right? The other one would convert this graph into how we have contributed these games. Timeline would be much smaller, and quantity may not have so different peaks every year, would probably be a steady rise or something. Would be cool to see quantity of games for older platforms being contributed to lately. Any chance you can make something like that?
Kennyannydenny (128164) on 1/13/2020 7:01 PM · Permalink · Report
Looking at the very big difference between Xbox One and PlayStation 4 (around 2016/2017 for example) the: 1) Xbox One has a lot less games than the PS4 2) PS4 games get added a lot more since they're scrape-able 3) There are just less Xbox players here than PS players adding stuff
Or maybe it's a combination of two or all three, or something completely different. But that just struck me as odd.
Kennyannydenny (128164) on 1/13/2020 9:48 PM · Permalink · Report
I know a lot of people who main on the Xbox One but none work on Mobygames :P I am a Xbox One main, and dear god no, i'd rather die than play Fifa, blegh. But yeah. I do thiink the scraping thing is also a reason, i've seen a lot of dlc's been scraped on PS4 and steam that are also on the Xbox One, but that platform is not added since it requires extra work :(
piltdown_man (235897) on 1/19/2020 4:53 PM · Permalink · Report
I find this really interesting. A lot of work has gone into this and I wish I was still clever enough to do this sort of thing. Big thanks & much respect.
My first impression when looking at the graph is that there are more games out there these days - which seems to be supported by the number of games that appear on my daily Steam queue - yet what I think of as the 'golden age' of games was the late 1980's / early 1990's.
So much of the new stuff seems to be either a rehash of an old game complete with 'pixel art' or a game made with RPGmaker/Unity/Unreal 4 that gives everything a generic look and feel.
Have we reached a point where it's all been done and everything from a few years back through to many years into the future will be a remake/rehash of something that has gone before ....?
The good old days weren't always that good but there was an energy that I don't feel these days - half a bottle of wine can send me into 'old man reminiscing mode' but am I alone in thinking this?
Rwolf (22823) on 1/19/2020 5:56 PM · edited · Permalink · Report
I guess I'm with piltdown_man, maybe it's because as we get older the memory of things done in our youth is seen through a golden-days haze, or it's just that the rehash of old stuff with new graphics does not appeal to me...like old movie remakes sometimes...it may look fresher but the gameplay/story is still the same. Same-same but different.
As to the increase in new games - I wonder how much separate add-on DLC content is responsible for the swelling in the recent numbers, or are they exempt in the graph? (Personally I would not really have such to be listed on par with 'new games' counters.)
vedder (70793) on 1/19/2020 6:02 PM · Permalink · Report
DLC, Compilations and Special Editions are not included in the graph. So this is purely new games.
What does inflate the number of games of recent years is that old games are re-released on new platforms. Tons of games from 8/16-bit consoles have been re-released on Switch, Steam and other major consoles.