Forums > News > MobyGames Stats - 2018 edition
vedder (70852) on 1/6/2019 10:54 AM · Permalink · Report
As per tradition, I present to you the database visualization! Made possible by the MobyGames API.
Previous editions:
January 2018 -
June 2017 -
January 2017 -
January 2016 -
January 2015 -
January 2014 -
January 2013 -
January 2012 -
January 2011 -
January 2010 -
January 2009
(Click to enlarge)
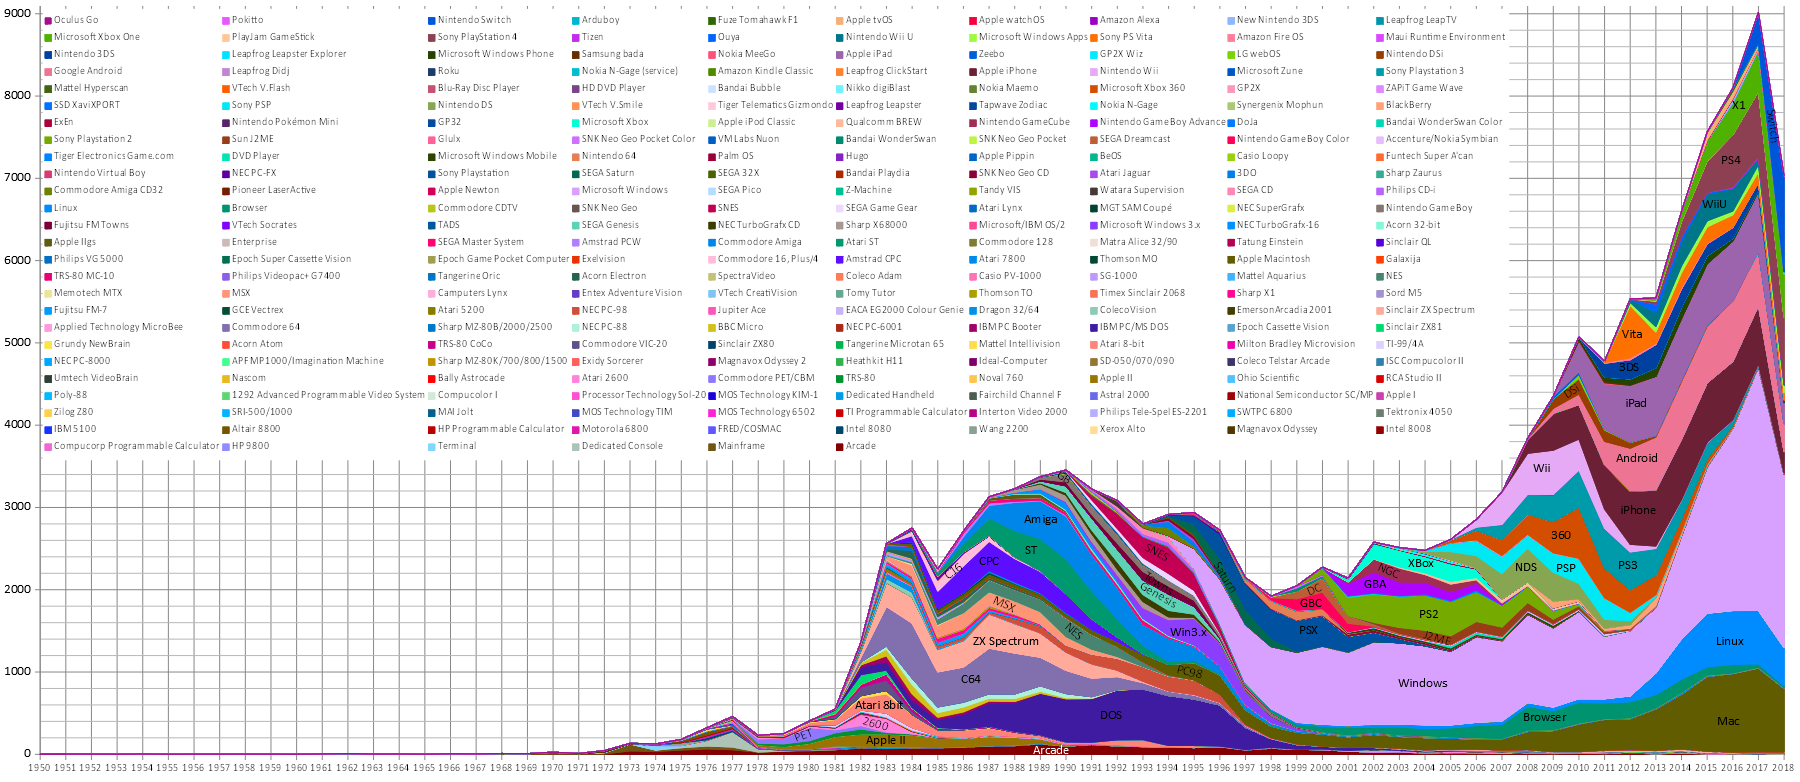
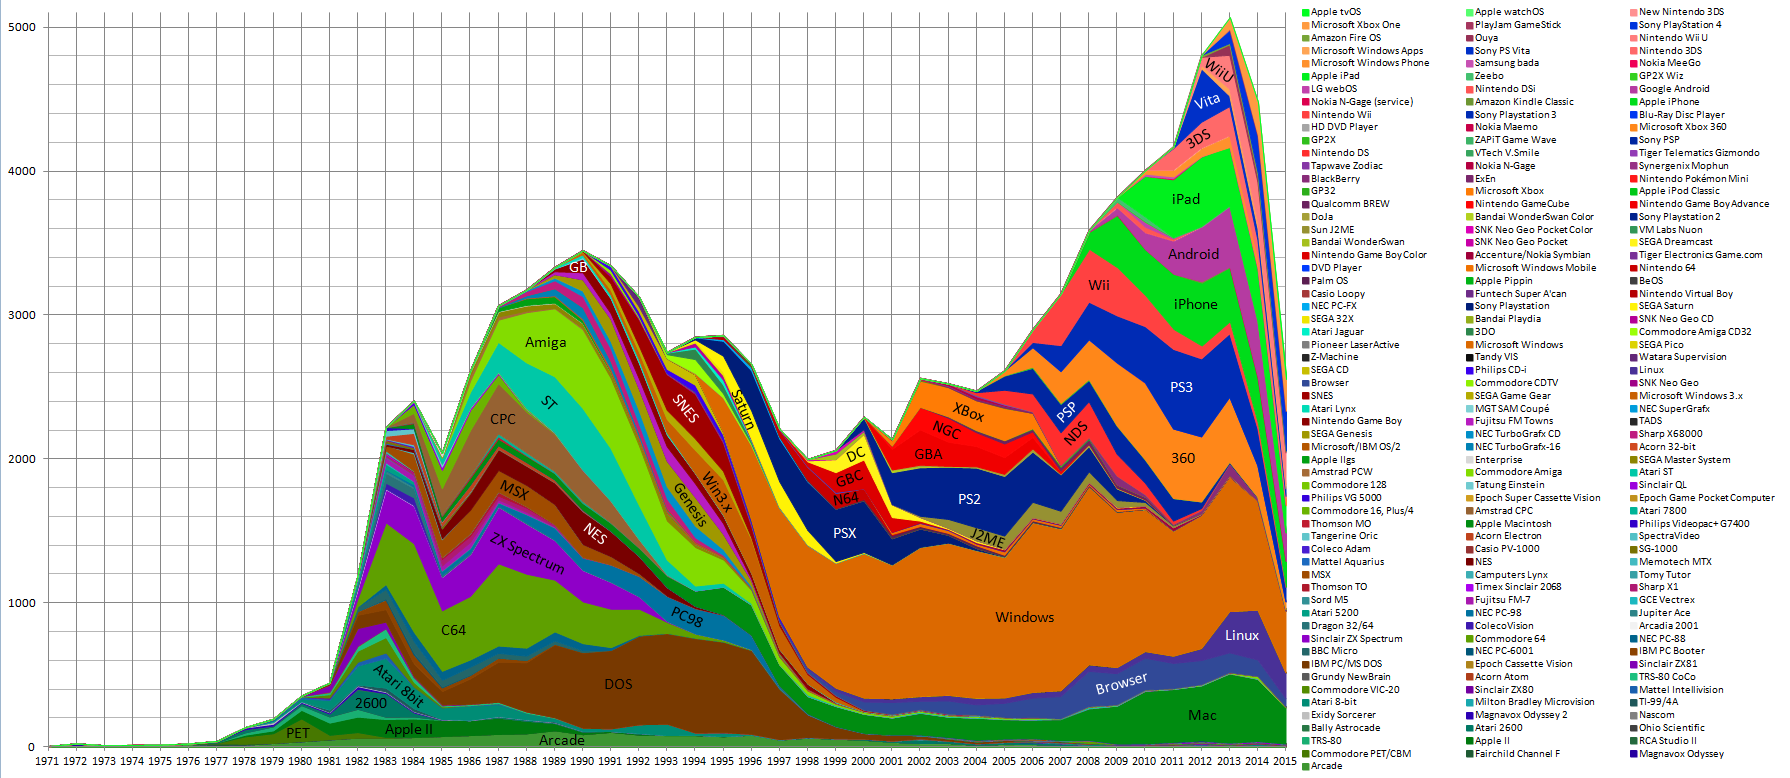
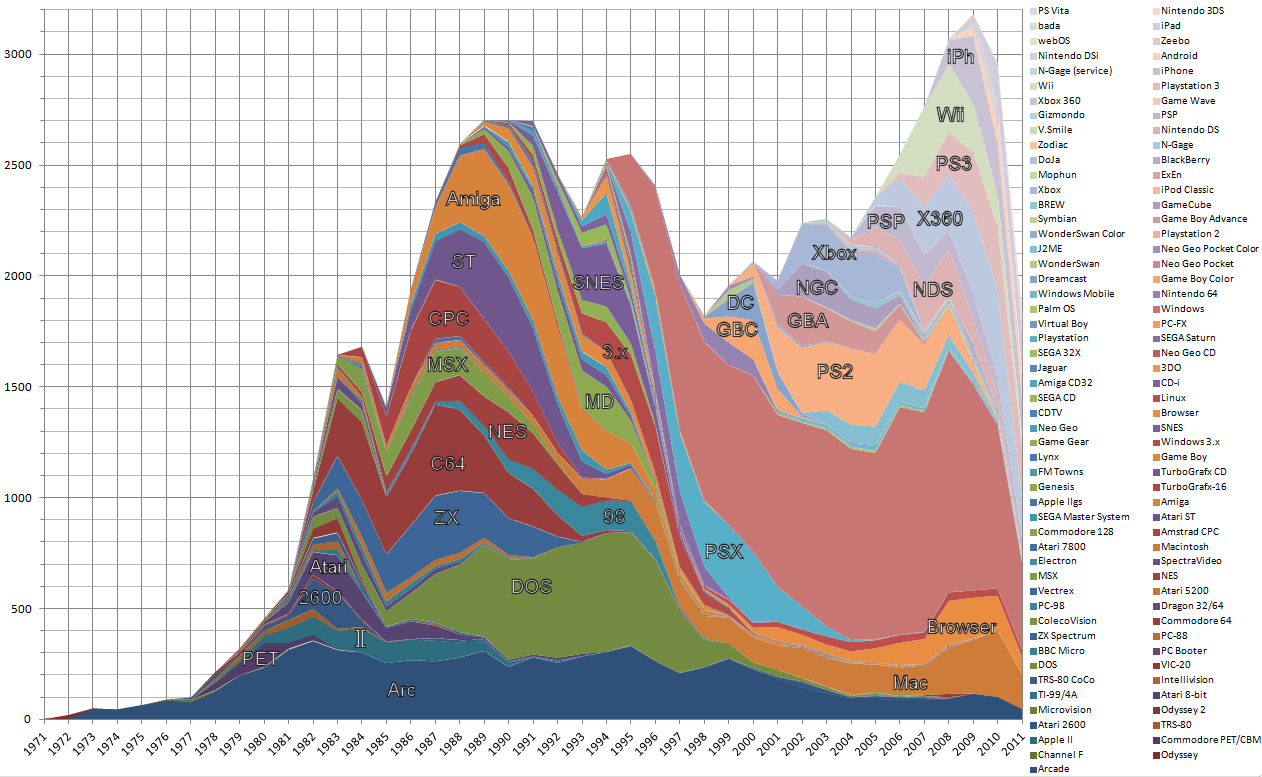
An explanation: each coloured shape in the graph represents a platform. The horizontal axis is time. The vertical axis represents the number of games released. So the height of a shape on a given point in time indicates the number of games released for that platform that year. The total height of the graph on a given point in time shows the total releases that year. The graph is meant to represent new game releases and thus excludes DLC, Special Edition and Compilation items. It does include each game for each platform it was released on.
Notable changes since last year:
- There are quite a lot of new platforms. In fact there are now so many that Excel refused to render the graph due to a hardcoded limit. I had to switch to LibreOffice to make the graph.
- Because I'm now excluding compilations, DLC and Special Edition releases, there are generally less releases per year visible. In particular 2017 ends up with 1000 games less than lass year's graph! My apologies to those who spent lots of time and effort to document DLC, but I just felt it was cluttering the graph!
- My pet project this year was documenting games from the late 60s and early 70s. Which shows as a tiny bump in an area of the graph that was previously almost flat.
- It looks like we didn't keep up with new releases as well as last year, judging from the drop-off in 2018.
- The coverage gap of 2016 has been filled it appears.
- Feel free to point out other interesting info in the graph!
[All data taken from MobyGames. Of course, the graph is only as complete as our database is. Come help us if you can!]
vedder (70852) on 1/6/2019 1:02 PM · Permalink · Report
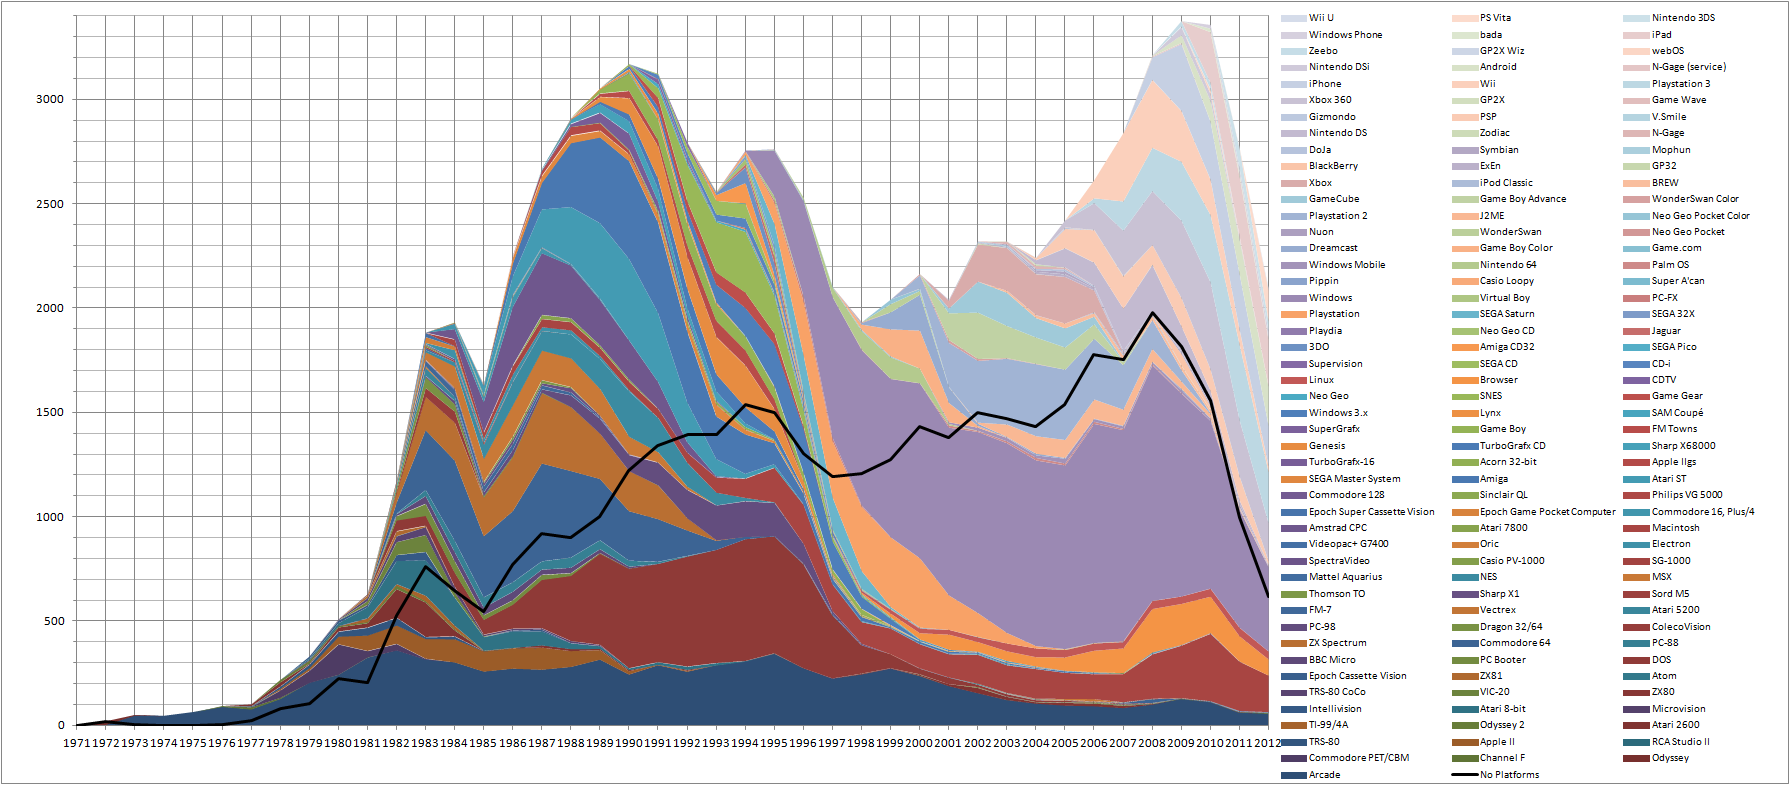
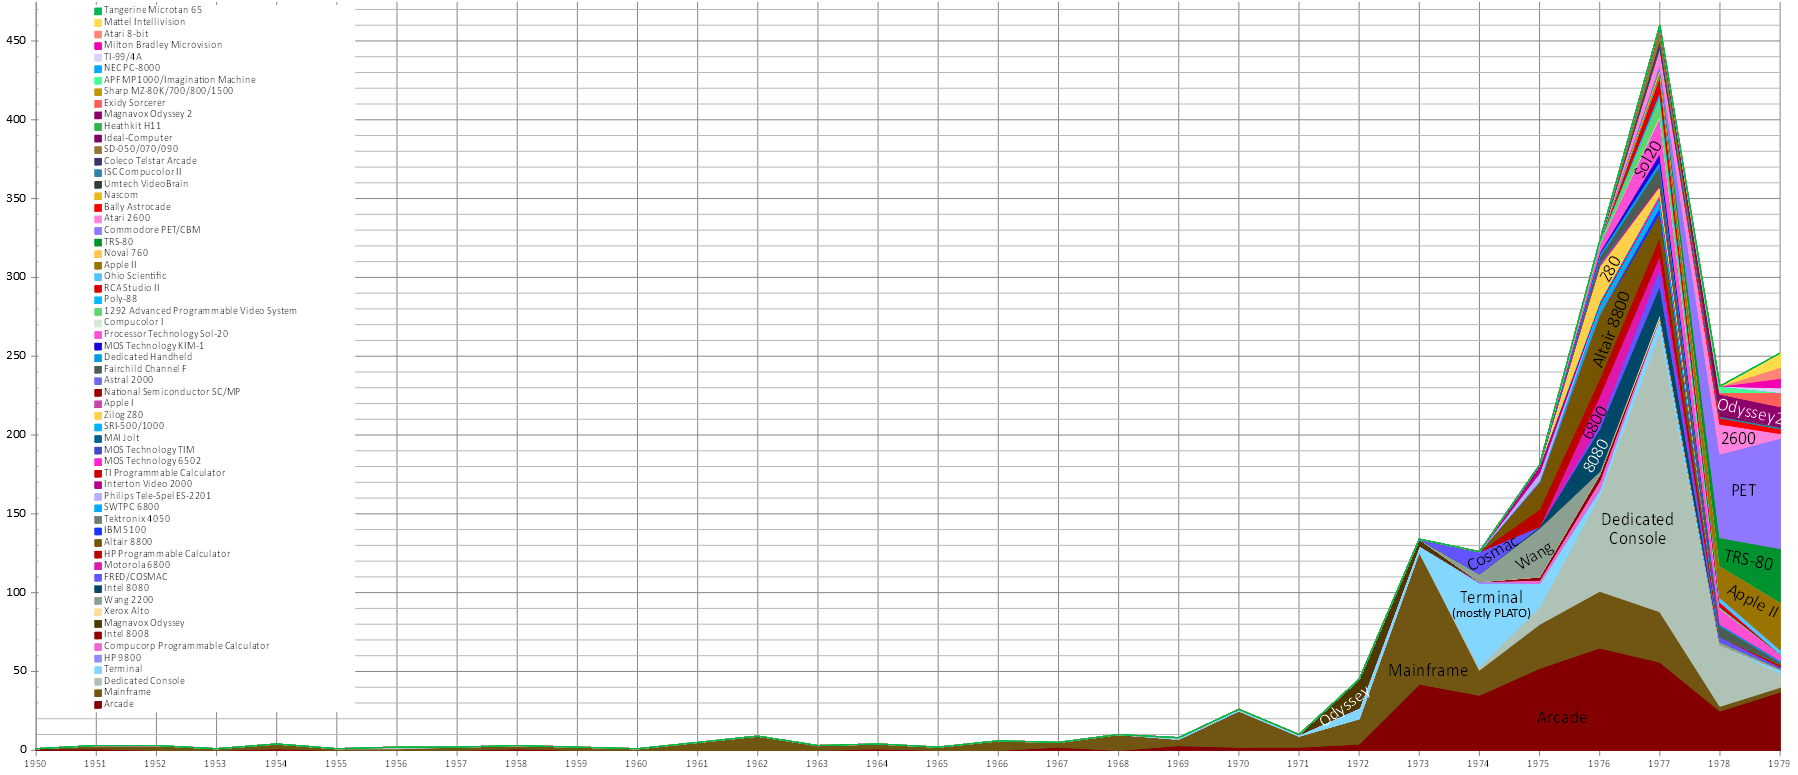
Here's a bonus graph. A closeup of 1950-1979:
(click to enlarge)
My ongoing quest of adding games more or less chronologically is currently in 1977 (as you can see from the big drop-off afterwards. I have over a 100 games on my todo-list for that year. That big drop in dedicated consoles after 1977 will remain however. That's the first video games crash of 1977 when European markets were flooded with dedicated Pong consoles, which quickly became outdated by cartridge based systems (The Atari 2600 and cheaper alternatives).
Patrick Bregger (301035) on 1/6/2019 1:07 PM · Permalink · Report
I just want to take the opportunity to not only thank you for your graph, but also your fantastic work in documenting videogame history.
Simon Carless (1834) on 1/6/2019 3:11 PM · Permalink · Report
This is GREAT, once again - thanks so much for doing it!
vedder (70852) on 1/6/2019 3:45 PM · Permalink · Report
More bonus graphs:
(click to enlarge)
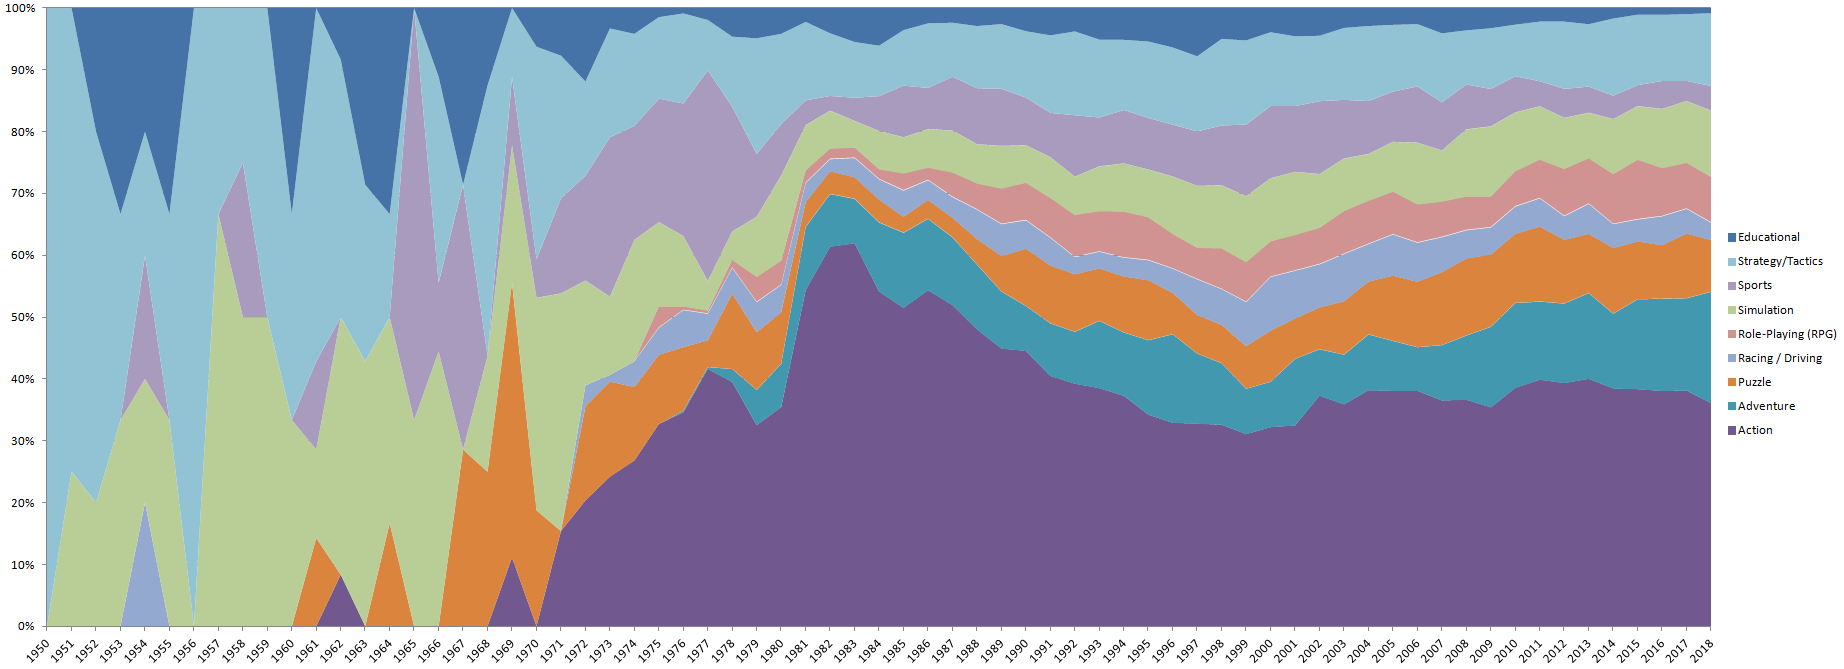
This image shows the which primary genre tags are used most in each year. The graph uses percentages. The percentages are for the total of tags used that year, not the total of games released that year (games can have more than one primary genre). DLC, Special Editions and Compilations are ignored.
(click to enlarge)
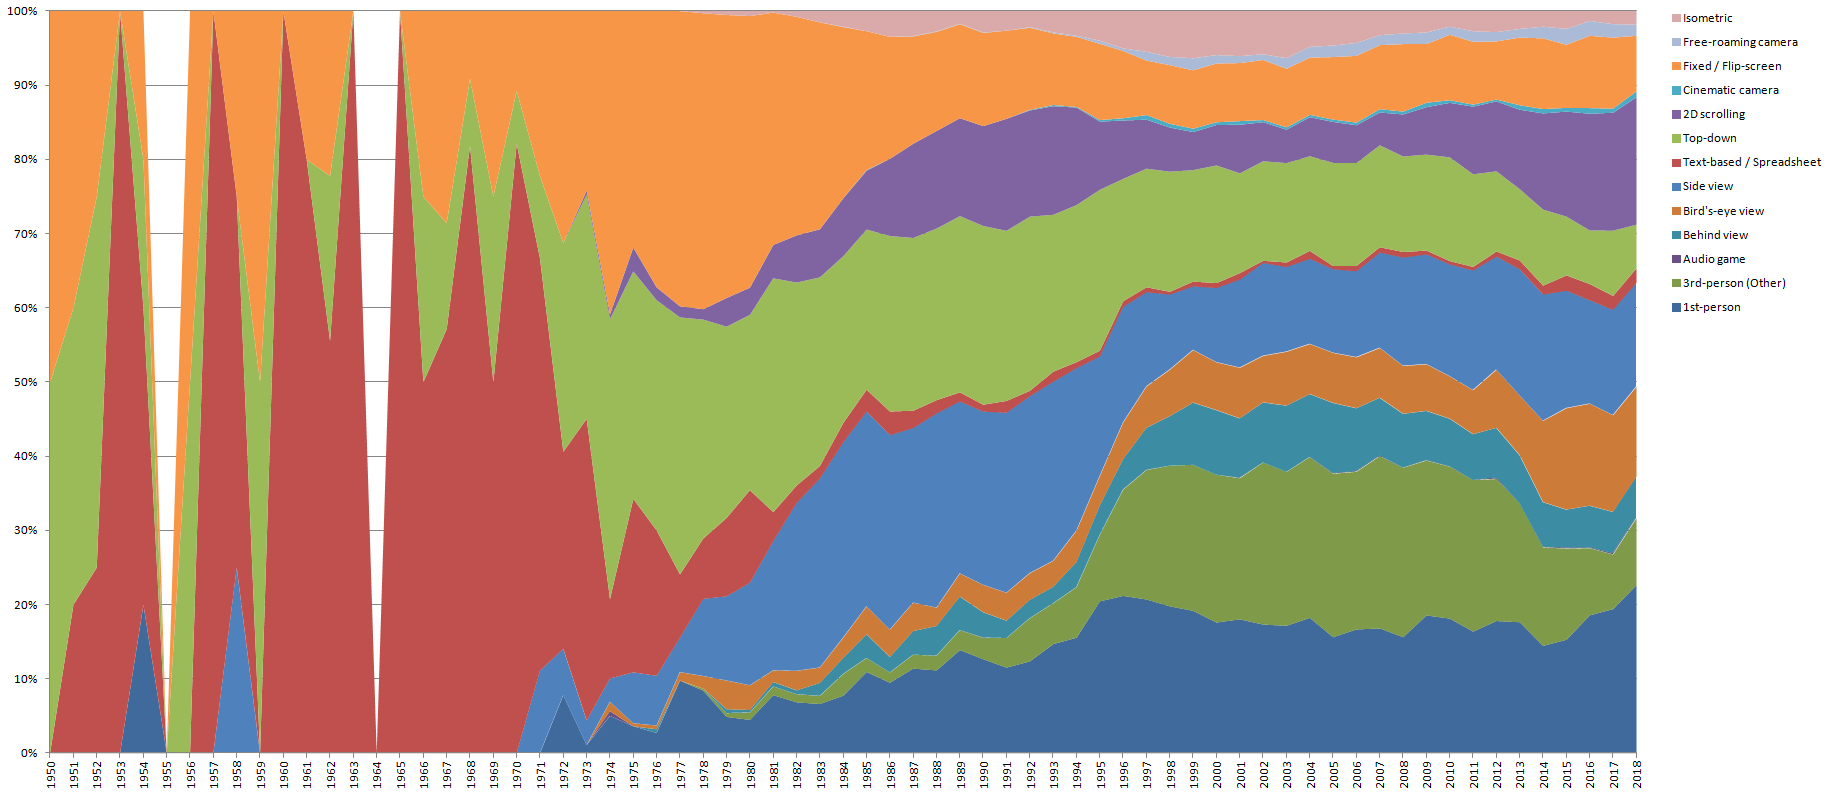
Similarly this image shows the most common Perspective and Visual tags.
Plok (214470) on 1/6/2019 5:02 PM · Permalink · Report
[Q --start vedder wrote--] - It looks like we didn't keep up with new releases as well as last year, judging from the drop-off in 2018. [/Q --end vedder wrote--] Did you consider that 2017 had DLCs, compilations etc. counted in its graph, or is that statement gauged upon that?
CalaisianMindthief (8172) on 1/6/2019 5:16 PM · edited · Permalink · Report
Nice!
Some things I've noticed:
- Games released in 1998 (2019) ~ 1900, games released in 1998 (2015) ~ 1900. In other words virtually no games released in 1998 were added to the database in 4 years. To compare year 1990--from ~3300 to ~3450 games, year 2001--from ~2050 to ~2150 games.
- A depression has appeared in 2011 compared to the previous edition's chart. The main culprits are Windows and Wii. Wii was reaching the end of its life cycle around that time, and Wii U hasn't been released until 2012. I've no idea what happened with Windows during 2011-2013, but it seems to go hand in hand with the rise of iOS and Android platforms.
vedder (70852) on 1/6/2019 7:39 PM · Permalink · Report
[Q --start CalaisianMindthief wrote--]I've no idea what happened with Windows during 2011-2013, but it seems to go hand in hand with the rise of iOS and Android platforms. [/Q --end CalaisianMindthief wrote--]
That could very well be related. A lot of casual games shifted from PC to mobile around that time.
MAT (240968) on 1/7/2019 1:46 AM · edited · Permalink · Report
But you're not counting all releases, right? If some Windows game was released say in 2011, and 2013 and 2017 with various re-releases, you'd only count it once and only for 2011, right?
Still, GOG and Steam probably release many games every year, and for Windows no less, so those years should still have many titles nevertheless.