Forums > News > MobyGames Stats - 2020 edition
vedder (71144) on 1/18/2021 9:04 AM · Permalink · Report
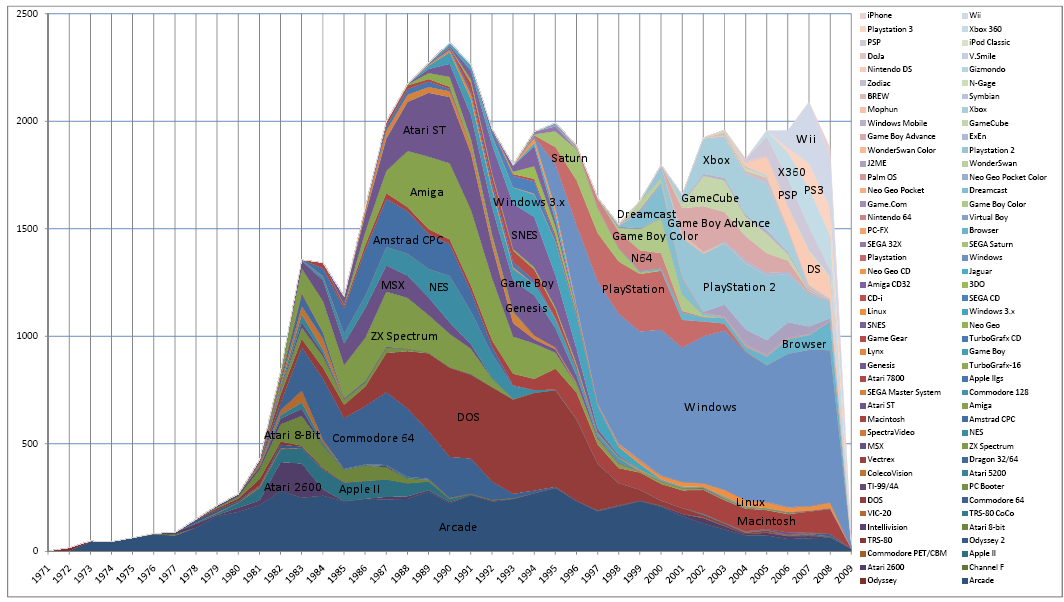
As per tradition, I present to you the database visualization! Made possible by the MobyGames API.
Previous editions:
January 2020 -
January 2019 -
January 2018 -
June 2017 -
January 2017 -
January 2016 -
January 2015 -
January 2014 -
January 2013 -
January 2012 -
January 2011 -
January 2010 -
January 2009
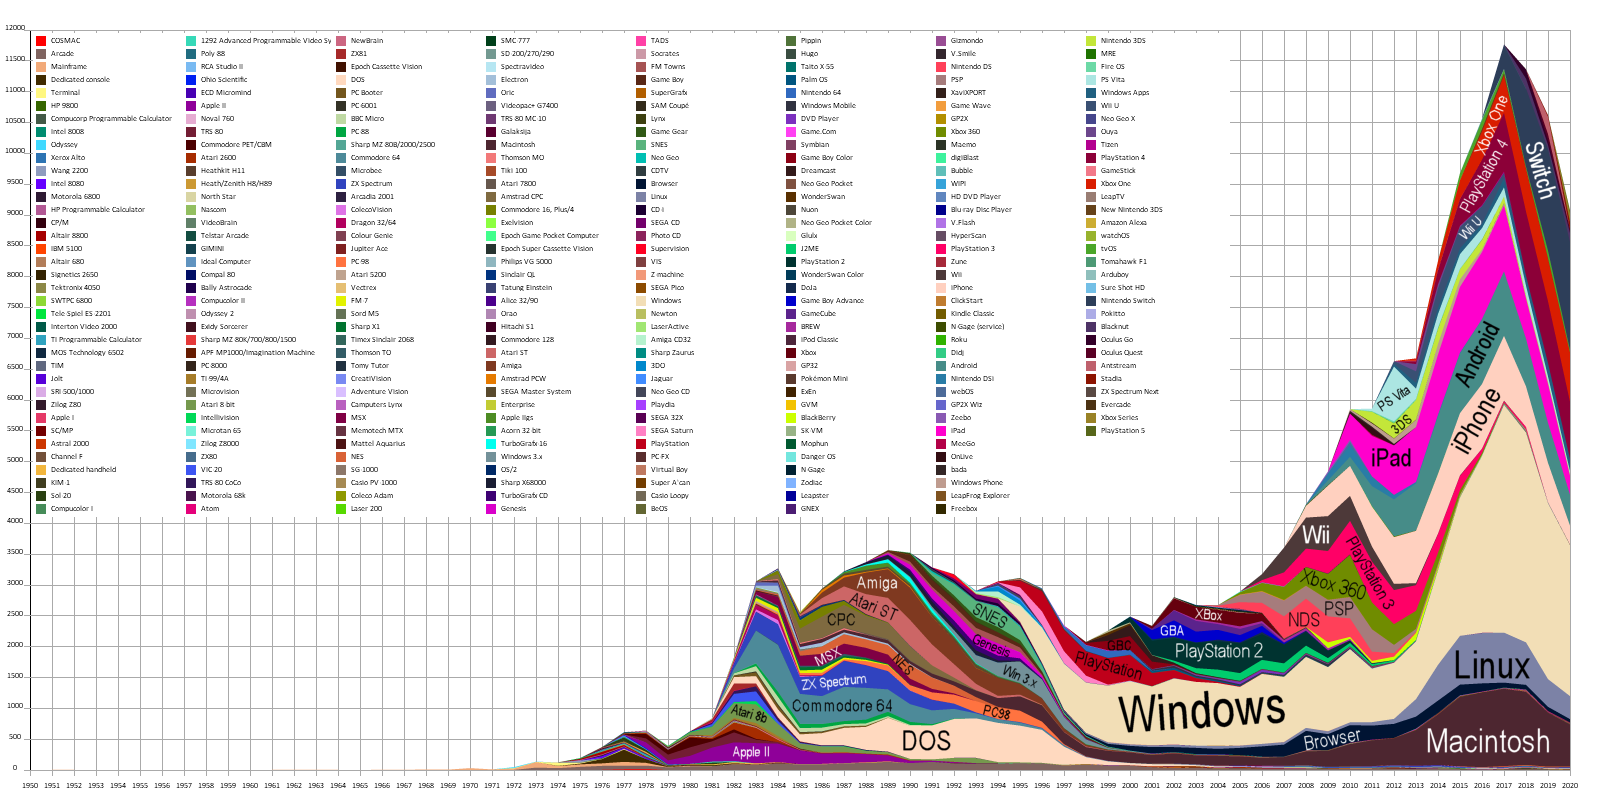
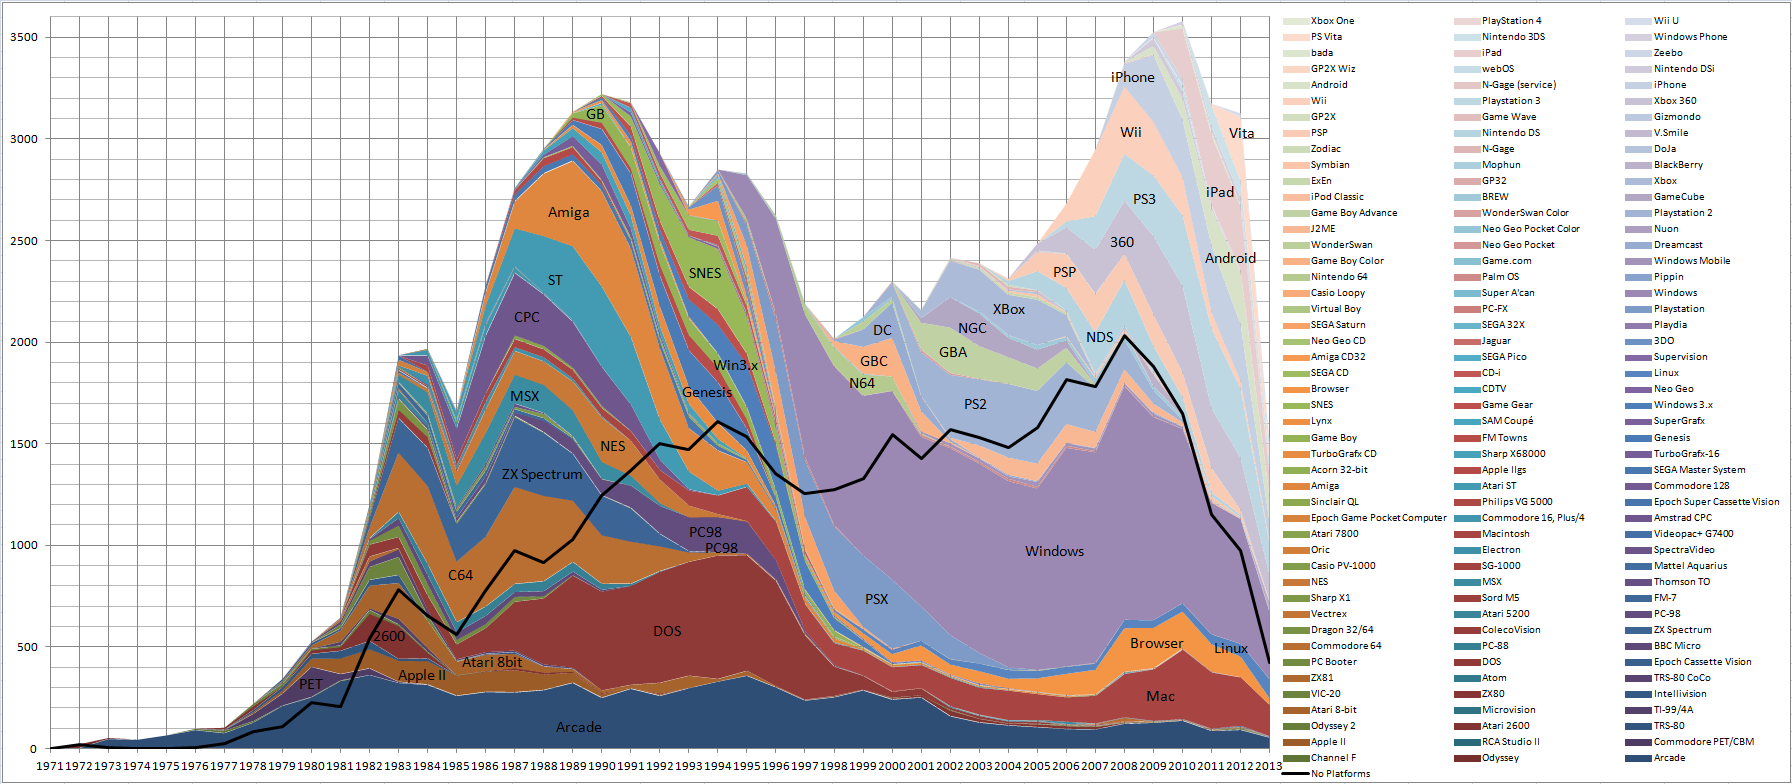
(Click to enlarge)
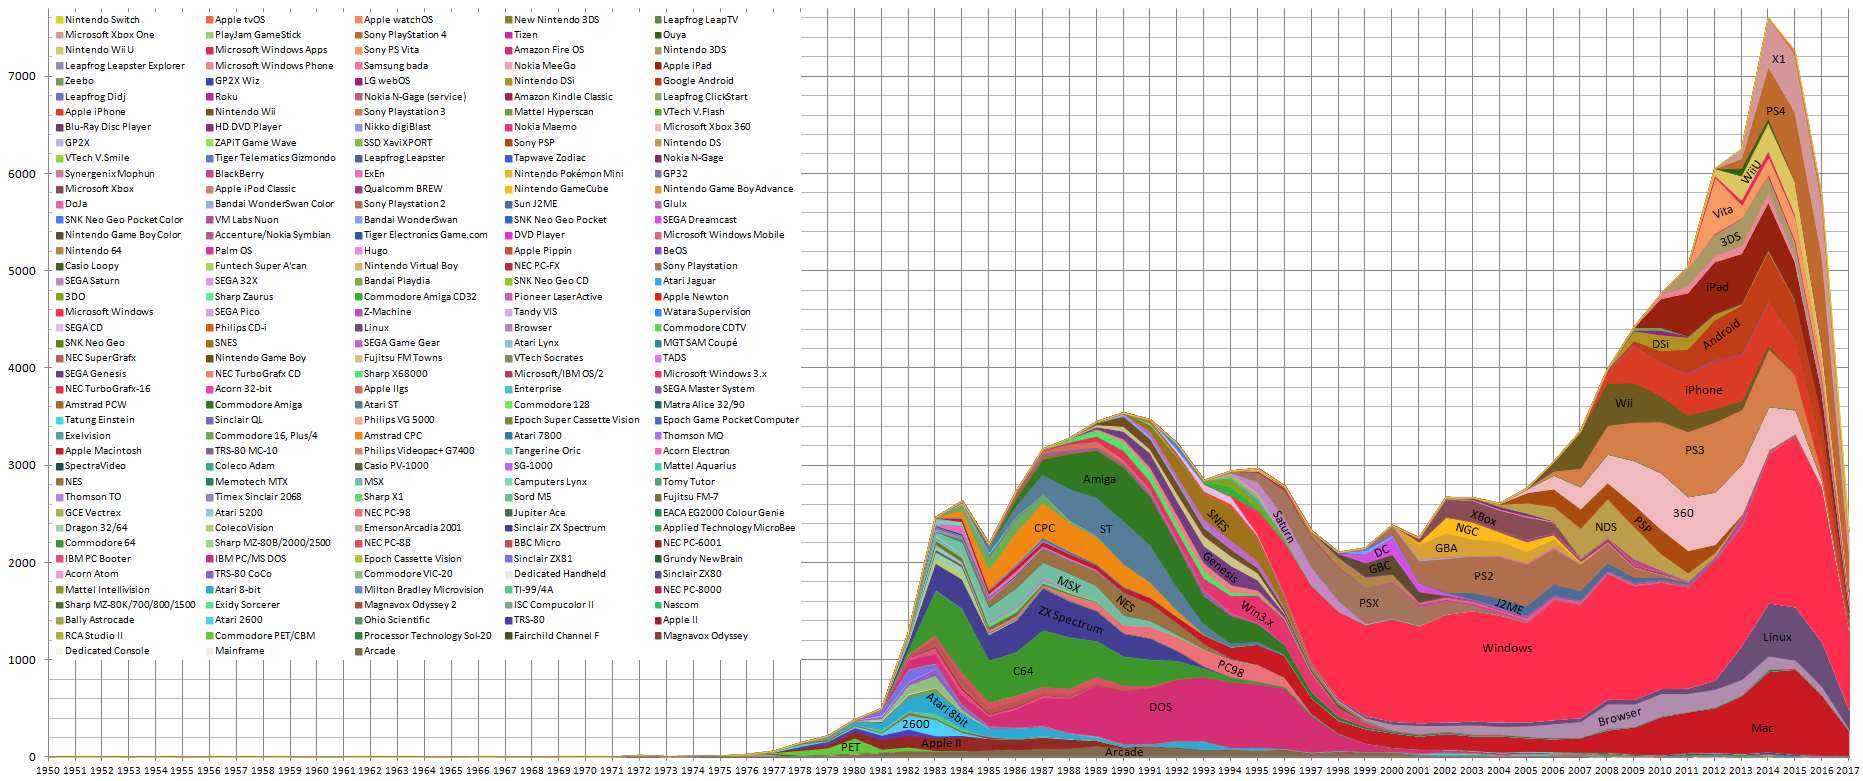
An explanation: each coloured shape in the graph represents a platform. The horizontal axis is time. The vertical axis represents the number of games released. So the height of a shape on a given point in time indicates the number of games released for that platform that year. The total height of the graph on a given point in time shows the total releases that year. The graph is meant to represent game releases and thus excludes DLC, Special Edition and Compilation items. It does include each game for each platform it was released on.
As usual we see a drop-off at the end, simply because we haven't been able to keep up with all the new game releases.
Feel free to point out interesting info in the graph and your contributions in the thread!
[All data taken from MobyGames. Of course, the graph is only as complete as our database is. Come help us if you can!]
firefang9212 (81837) on 1/18/2021 7:06 PM · Permalink · Report
These are always interesting to see and also a reminder of the various platforms that I need to get back to adding stuff to.
Cavalary (11448) on 1/18/2021 9:08 PM · Permalink · Report
Always nice to see.
As for the peak being three years ago, which seems quite common in previous years too, strikes me as a good moment to start getting interested in a game, three years after release. May actually be finished and patched by then...
Minhoca (1473) on 1/19/2021 1:51 AM · Permalink · Report
I find interesting how many more Windows games there are compared to other platforms. I don't think this is because games are made much more to Windows than other platforms, but rather that it's what most people here focus on archiving first. I believe there are probably way more Android games than this chart shows (even though many have questionable quality) due to this reason.
I might be wrong, so what do you guys think?
Pseudo_Intellectual (66423) on 1/19/2021 3:06 AM · Permalink · Report
Mobygames has a Windows (Steam) scraper, but not an Android (Google Play) scraper. Mostly we document what is easy to document.
vedder (71144) on 1/19/2021 1:42 PM · Permalink · Report
[Q --start Minhoca wrote--]I find interesting how many more Windows games there are compared to other platforms. I don't think this is because games are made much more to Windows than other platforms, but rather that it's what most people here focus on archiving first. I believe there are probably way more Android games than this chart shows (even though many have questionable quality) due to this reason.
I might be wrong, so what do you guys think? [/Q --end Minhoca wrote--]
On iOS in 2019 about 1700 games were released per month up from 500 per month in 2016. So that would more than double the height of the graph for just covering all iOS games in 2019. Couldn't quickly find specific numbers for Android, but apps in general it's about 4 time as many, so do the math.
This isn't just because we don't have a scraper for Android, it's because the sheer volume just makes the task too daunting.
Pseudo_Intellectual (66423) on 1/19/2021 3:32 PM · Permalink · Report
Scraper sure helps though! 8)
vedder (71144) on 1/21/2021 8:35 PM · Permalink · Report
I created animated "bar chart races", because they are all the rage right now.
Here's one that uses year-by-year data
This one uses cumulative data over time for each platform
Pseudo_Intellectual (66423) on 1/26/2021 3:40 PM · Permalink · Report
it truly was the NES before the NES, the promised one leading the way following the collapse of the 2600 and its ecosystem.
piltdown_man (242948) on 7/2/2021 5:12 PM · Permalink · Report
Saw this on the home page and thought 'Yeah! That's the usual graph we get around this time of year' and didn't really spend any time looking at it. (Not that I don't appreciate the hard work or the expertise - just that it's something I don't get a lot out of.)
Today I had a closer look for some reason and noticed that the most prominent platform was DOS! On even closer inspection it seems that on my screen the graph starts waaay back in time and then fits in just as much as it can, as a result it was truncating the graph in the 1990's. It's a bit like having a 'left justified' point of view.
Anyone else notice this?
Is a 'right justified' point of view possible and would it be of more use?
Cavalary (11448) on 7/2/2021 11:54 PM · Permalink · Report
Scrolling right on a large image never struck me as something to even make a note of. Or you could set your browser to automatically resize images, but I'd say it's too tiny to make out all but the major platforms during their mainstream life as it is.
vedder (71144) on 7/3/2021 6:46 AM · Permalink · Report
I can't change the alignment on the front page, also I don't think I can change to smaller image because editing the post won't change what's shown on the frontpage.In any case you can just click the image to get it full screen.
piltdown_man (242948) on 7/7/2021 6:51 PM · edited · Permalink · Report
Fair enough.
I do not think a smaller image would help - there's so much information on there that would be lost. I was just surprised to see DOS as the most prominent game type - not in the least bit worried by that 'coz I'm still playing DOS games - just surprised and I wondered if anyone else had noticed.
Looks really impressive in full screen mode
Cavalary (11448) on 7/8/2021 12:24 AM · Permalink · Report
How is DOS the most prominent platform? Windows trumps everything massively, then there's Mac, I'd say DOS is somewhere around the level of iPhone, iPad and Android, but that Linux bulge means it'll also be in that contest in the coming years, while DOS won't be.